
PWD Topographic Surveys — ~700 km
Roads & Highways · Multiple project locations
Project Overview
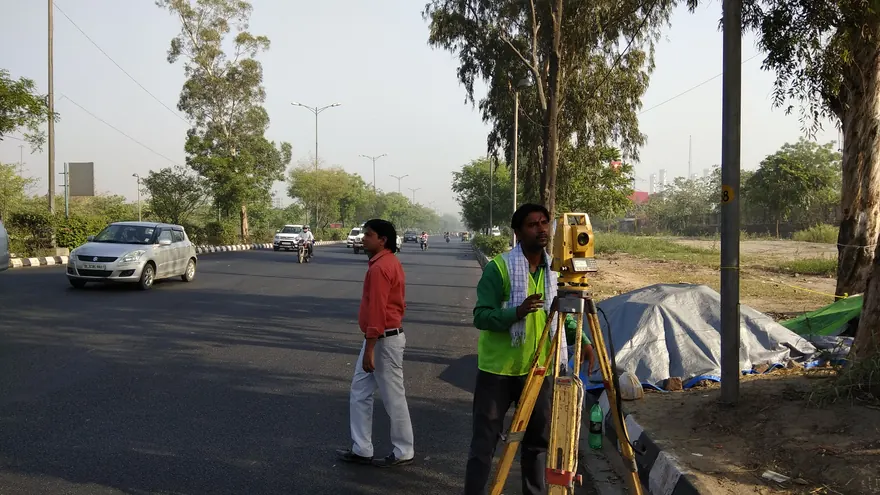
BTPL has carried out road topographic surveys for PWD across a number of separate projects, covering approximately 700 km of road in total at multiple project locations. The method is conventional and chosen for the purpose — GNSS control, total station detail and digital levelling — because a road improvement design is set against levels observed on the running surface itself. Each project was delivered as a topographic plan with longitudinal and cross sections in CAD, on its own control framework and its own chainage.
What did PWD require?
Improvement, widening, strengthening and drainage work on an existing road is designed against the road as built, not as originally drawn. The design office needs the measured carriageway geometry and crown levels along the route, the invert and gradient of the existing drainage, the position of structures, utilities, poles and chambers, and the width available between the road and its boundary. The longitudinal section governs how a new profile can be tied into the existing surface without excessive raising or unacceptable overlay thickness; the cross-sections govern widening, camber correction, side drain design and the earthwork quantity. Directly observed levels on the carriageway are what make those decisions defensible, which is why work of this kind is taken on the ground.
What made this project challenging?
- Where a road is open to traffic, instruments, prisms and staff have to work on carriageways and shoulders in use, which limits where a setup can stand and what can be observed from it.
- Approximately 700 km accumulated across separate projects, each with its own control, its own chainage origin and its own drawing set, while method, feature coding and presentation had to stay consistent so that the department received comparable deliverables from every job.
- Where roadside occupation, parked vehicles or stacked material stand over the kerb, drain and boundary line, they obstruct line of sight and physically cover the detail the survey exists to record.
- Utilities and drainage that cannot be read from the surface: chambers, inlets, culvert and drain inverts and pole positions had to be measured directly, with covers lifted where safe and permitted.
How did BTPL carry out the survey?
Each project started with control of its own. GNSS was observed at intervals along the route and laid out as intervisible pairs, so that a setup could be orientated without leaning on a single mark; where reception was unreliable the framework was carried through on closed traverses instead of being broken and restarted; and digital levelling connected it to the benchmarks available for that stretch, giving one continuous framework in both plan and height. Chainage was then run along the road and referenced to marks set clear of the carriageway, where traffic and roadworks were less likely to reach them. Detail was captured by total station and RTK with feature coding applied in the field — carriageway edges, crown and centreline levels, kerbs, shoulders, drains and inverts, culverts and structures, utility features, boundary walls and property frontage. Cross-sections were observed square to the centreline at the prescribed interval and taken out to the required width beyond the road boundary, with extra sections at structures, junctions and curves, where the ground changes shape faster than the interval can describe. Long routes were divided into reaches with deliberate overlap between adjoining ones, so that two records of the same ground could be set against each other where they met.
How was the data processed?
Nothing entered a drawing until the framework behind it had been reduced and adjusted, the traverse and the level network each closed and accepted on its own terms for that project. Field codes were then translated into line work and surfaces and the topographic plan drawn from them, the longitudinal section generated from centreline levels against chainage, and the cross-sections plotted at the prescribed interval. Structures, drainage and utility features were kept on layers of their own, so that a designer can pull out the existing things an improvement has to meet without carrying the whole topographic picture along with them. Each set was assembled last to the layering and presentation standard the department's submission requires.
How was accuracy verified?
Checks ran at three levels. The framework was accepted on misclosure — traverses closed onto independent control, level runs double-run and closed onto the benchmarks adopted for the stretch, with the closing figures judged against accepted survey practice before detail was taken into the drawing. The detail itself was tested by re-shooting selected points from a different station, which turns a bad orientation or a mis-measured instrument height into a visible disagreement in the field. The drawn output was tested last: selected cross-sections re-observed on site, plotted sections compared back against the field record and against observed carriageway levels, feature coding and drain, structure and boundary attributes verified on site against the compiled plan, and string continuity, layering and completeness reviewed across the CAD set before it went out.
What was delivered?
Each project closed with a measured topographic plan of the road, longitudinal and cross sections and a control and benchmark register, all held on one framework for that stretch; across the projects the deliverables are consistent in form and cover approximately 700 km of road in total. Improvement and widening geometry, profile tie-ins, drainage design, earthwork assessment and the width available between road and boundary can each be worked out from directly observed ground data, and the control is left on site in recoverable form for setting out and for any later survey on the same stretch.
PWD
Deliverable extracts (orthomosaic, terrain, CAD) will be added once cleared for publication (client-sensitive information removed per BTPL policy).
Planning a Similar Project?
Share your location, scope and required deliverables — BTPL will propose the appropriate survey methodology.