
Landslide Site Surveys — 7 Locations
Slope Stability / Disaster Management · Himachal Pradesh
Project Overview
Seven landslide locations across Himachal Pradesh were surveyed by BTPL using UAV photogrammetry, to provide the measured ground on which protection works could be designed. NHAI engaged BTPL as a third party. Each location was a discrete mobilisation with its own control and its own flight plan, and each was closed out with an orthomosaic, terrain model, slope analysis and volume computation.
What did NHAI require?
Protection work on a failed slope — retaining and breast walls, anchored mesh or netting, catch fences, regrading, drainage or debris clearance — can only be designed against the actual geometry of the ground: where the scarp sits, how steep each part of the face is, how far the debris has travelled and how much material is involved. That geometry cannot be obtained by walking the slope, because the surface in question is the failed ground itself, which is unsafe to occupy. Aerial capture measures the whole failure at once, including the parts nobody can reach, and produces a terrain model from which gradient and volume both follow. The same record fixes the condition of the slope at the time of survey, which is what any later comparison of movement or further loss has to be measured against.
What made this project challenging?
- Ground that is unstable by definition: the failed mass itself cannot be occupied, so control had to be founded on stable ground around each slide and the failure measured from there.
- The hazard of further fall from above a scarp, which limits where a crew can stand and how long they can stay, and so limits where control targets can be placed and observed.
- Very steep faces, which a nadir flight represents poorly and which need oblique capture if the face is to appear in the model at all.
- Seven locations, each a separate mobilisation with its own control, and an analysis and drawing set at each that had to follow the same rules if the seven were to be read together.
- Where a site adjoins or sits above a live carriageway, work near the toe had to fit around traffic and whatever road-safety restriction was in force at that location.
- No pre-failure surface was available to difference against, so any quantity had to be computed against a reference surface reconstructed and declared for that site, and the figure is only readable on that declared basis.
How did BTPL carry out the survey?
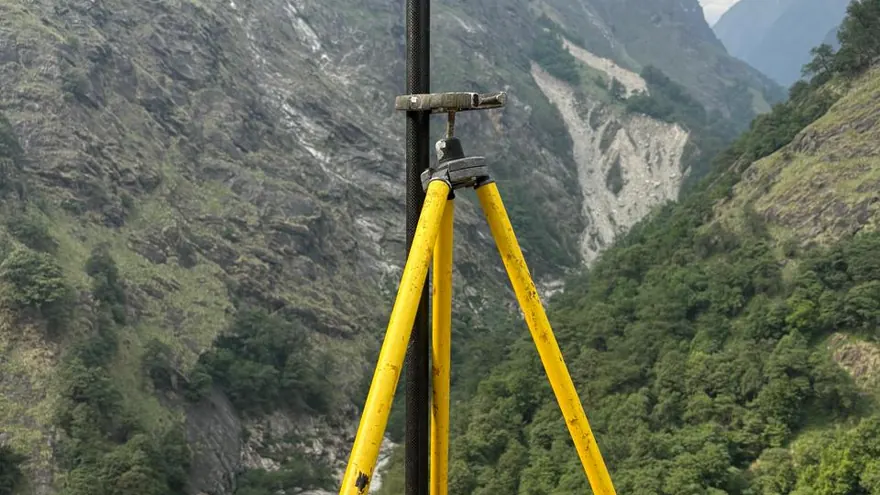
At each of the seven locations control was established first, on ground judged stable and clear of the active failure, observed by GNSS and tied to the national datum and to available highway or project reference marks, so that the site model would sit correctly against existing records. Control targets were pre-marked where they could be placed and observed safely, and positioned to surround the failure and span its height range, so that the photogrammetric solution was held from above, below and either side of the disturbed ground. Capture was flown with nadir coverage of the slide and its run-out, supplemented by oblique passes across the scarp and the steepest faces, with flight lines set to suit the aspect of each slope. Ground observation was confined to the stable margins and taken only where it was safe to take, the failed surface itself being measured entirely from the air.
How was the data processed?
Each site's imagery was triangulated on that site's control and matched to a dense point cloud, which was classified to separate bare ground from vegetation and debris cover. On the disturbed ground the classification was reviewed by hand: loose material, uprooted vegetation and displaced blocks do not separate cleanly by automatic rule, and where the ground surface lies beneath them is a judgement that has to be made and recorded. Gradient and aspect were derived from the accepted terrain model to give the slope analysis. The volume was then computed between the surveyed surface and a reference surface defined for that site, with the definition adopted recorded alongside the result, so that the figure carries its own basis. Orthomosaics and CAD drawings were compiled per site to one datum and one layering standard.
How was accuracy verified?
Check points observed on stable ground and withheld from the adjustment were used to verify each site model, placed so that the upper and lower parts of the slope were both tested and not only the ground a crew could reach. Overlap between adjacent strips, and between the nadir and the oblique capture, was compared for continuity of the surface across the steep faces. Classified ground was reviewed against the imagery over debris and vegetation, where the line between loose material and ground is a judgement. Slope analysis was read back against the terrain model and against what is visible in the orthomosaic. Volumes were computed only on the accepted surface, and the reference surface, the method and the limits of the computation were stated in the deliverable, so that the figure is read on its declared basis.
What was delivered?
Each of the seven locations was closed out with its own orthomosaic, terrain model, slope analysis and volume computation, all on a consistent datum. Protection and retention works can be designed against measured slope geometry, and against material quantities traceable to a stated reference surface, rather than against ground estimated from a position nobody could safely reach. The set also records the condition of each slope as surveyed.
NHAI (as third party)
Deliverable extracts (orthomosaic, terrain, CAD) will be added once cleared for publication (client-sensitive information removed per BTPL policy).
Planning a Similar Project?
Share your location, scope and required deliverables — BTPL will propose the appropriate survey methodology.